TUESDAY- 22/June (Day 1): The first day was devoted to test the acoustic equipment and to calibrate the hydrophones (16) of the ULVA array
|
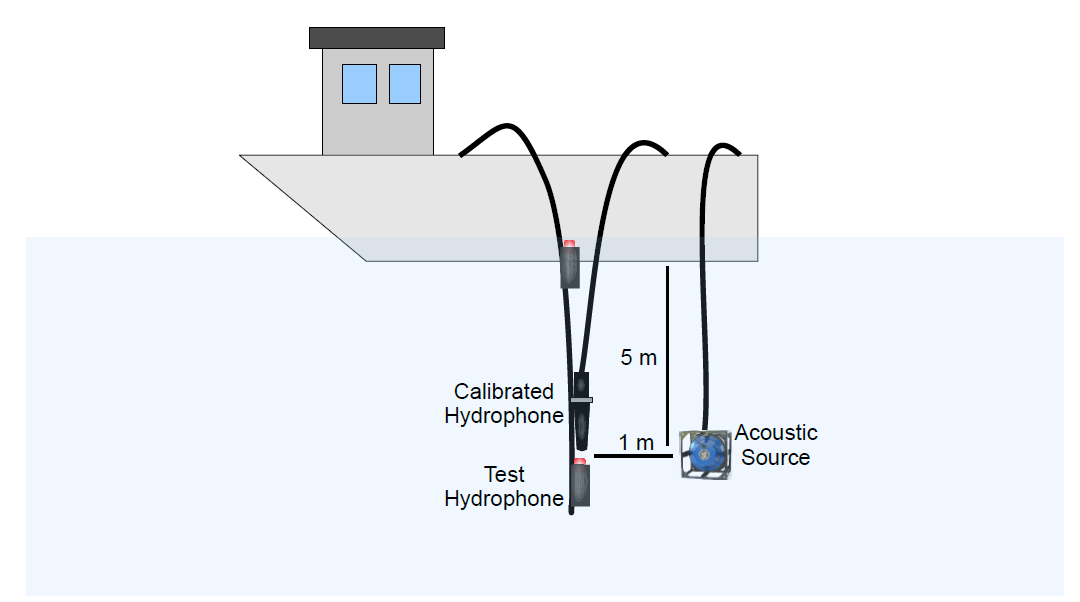
TUESDAY- 22/June (Day 1): The first day was devoted to test the acoustic equipment and to calibrate the hydrophones (16) of the ULVA array |
| Calibration setup |
 |
 |
WEDNESDAY-23/June (Day 2):
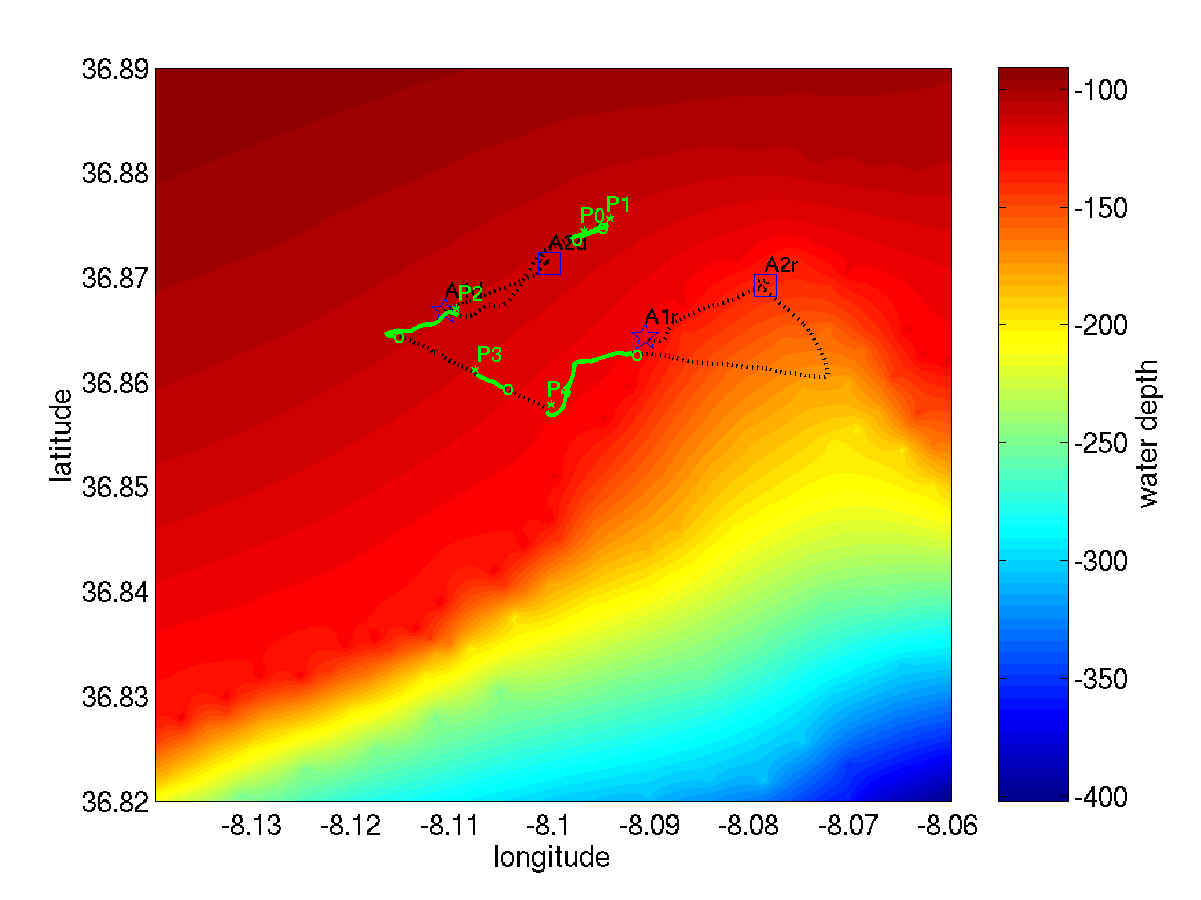
Field calibration and communications signals were transmitted to AOB21 and AOB22 in along a range independent bathymetry area. The star A1d represents
the deployment position of AOB21 and the star A1r its
recovery position. Similarly, the square A2d represents the
deployment position of AOB22 and the square A2d its recovery
position. The buoys were deployed in a line of constant
bathymetry. Since, the GPS systems of both AOBs did not work,
those positions were given by the ship (source) GPS, and there is
no positioning information for the AOBs between the deployment and
recovery. The ship/source track is represented by the dotted line.
The green lines over the ship track represents the positioning of
source during field calibration events. These events are labelled
as P0, P1, P2, P3, P4. The location
of the label represents the starting point of field calibration events.
|
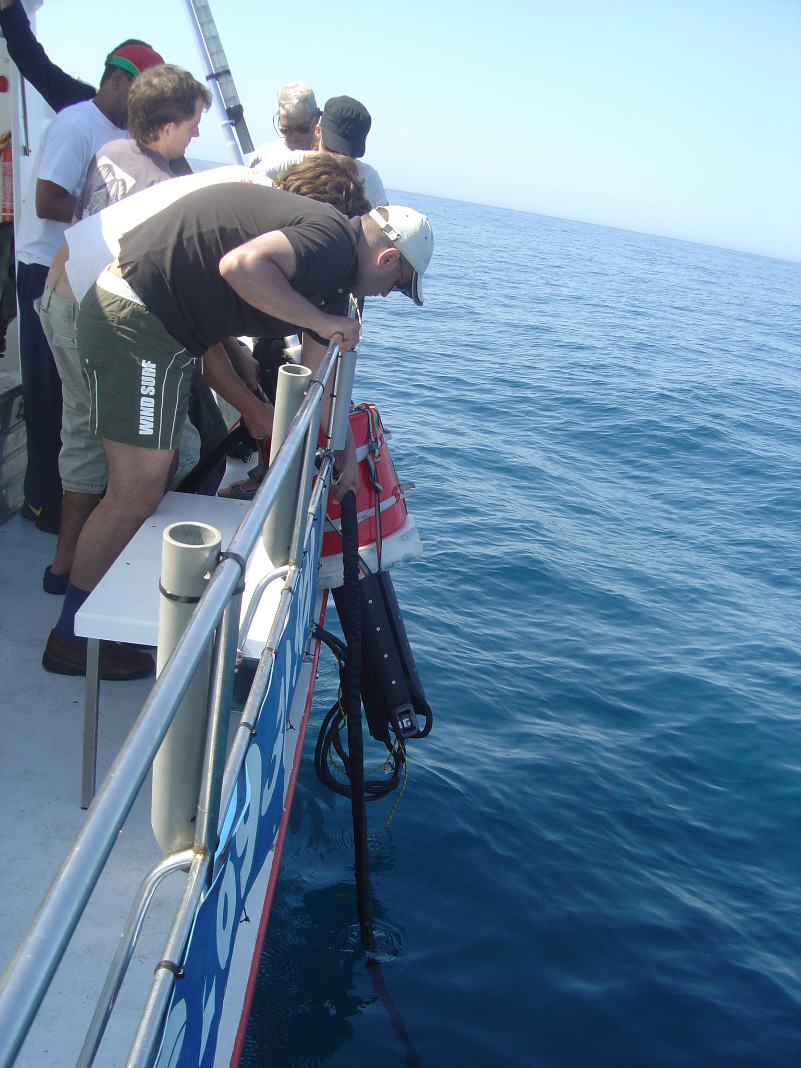
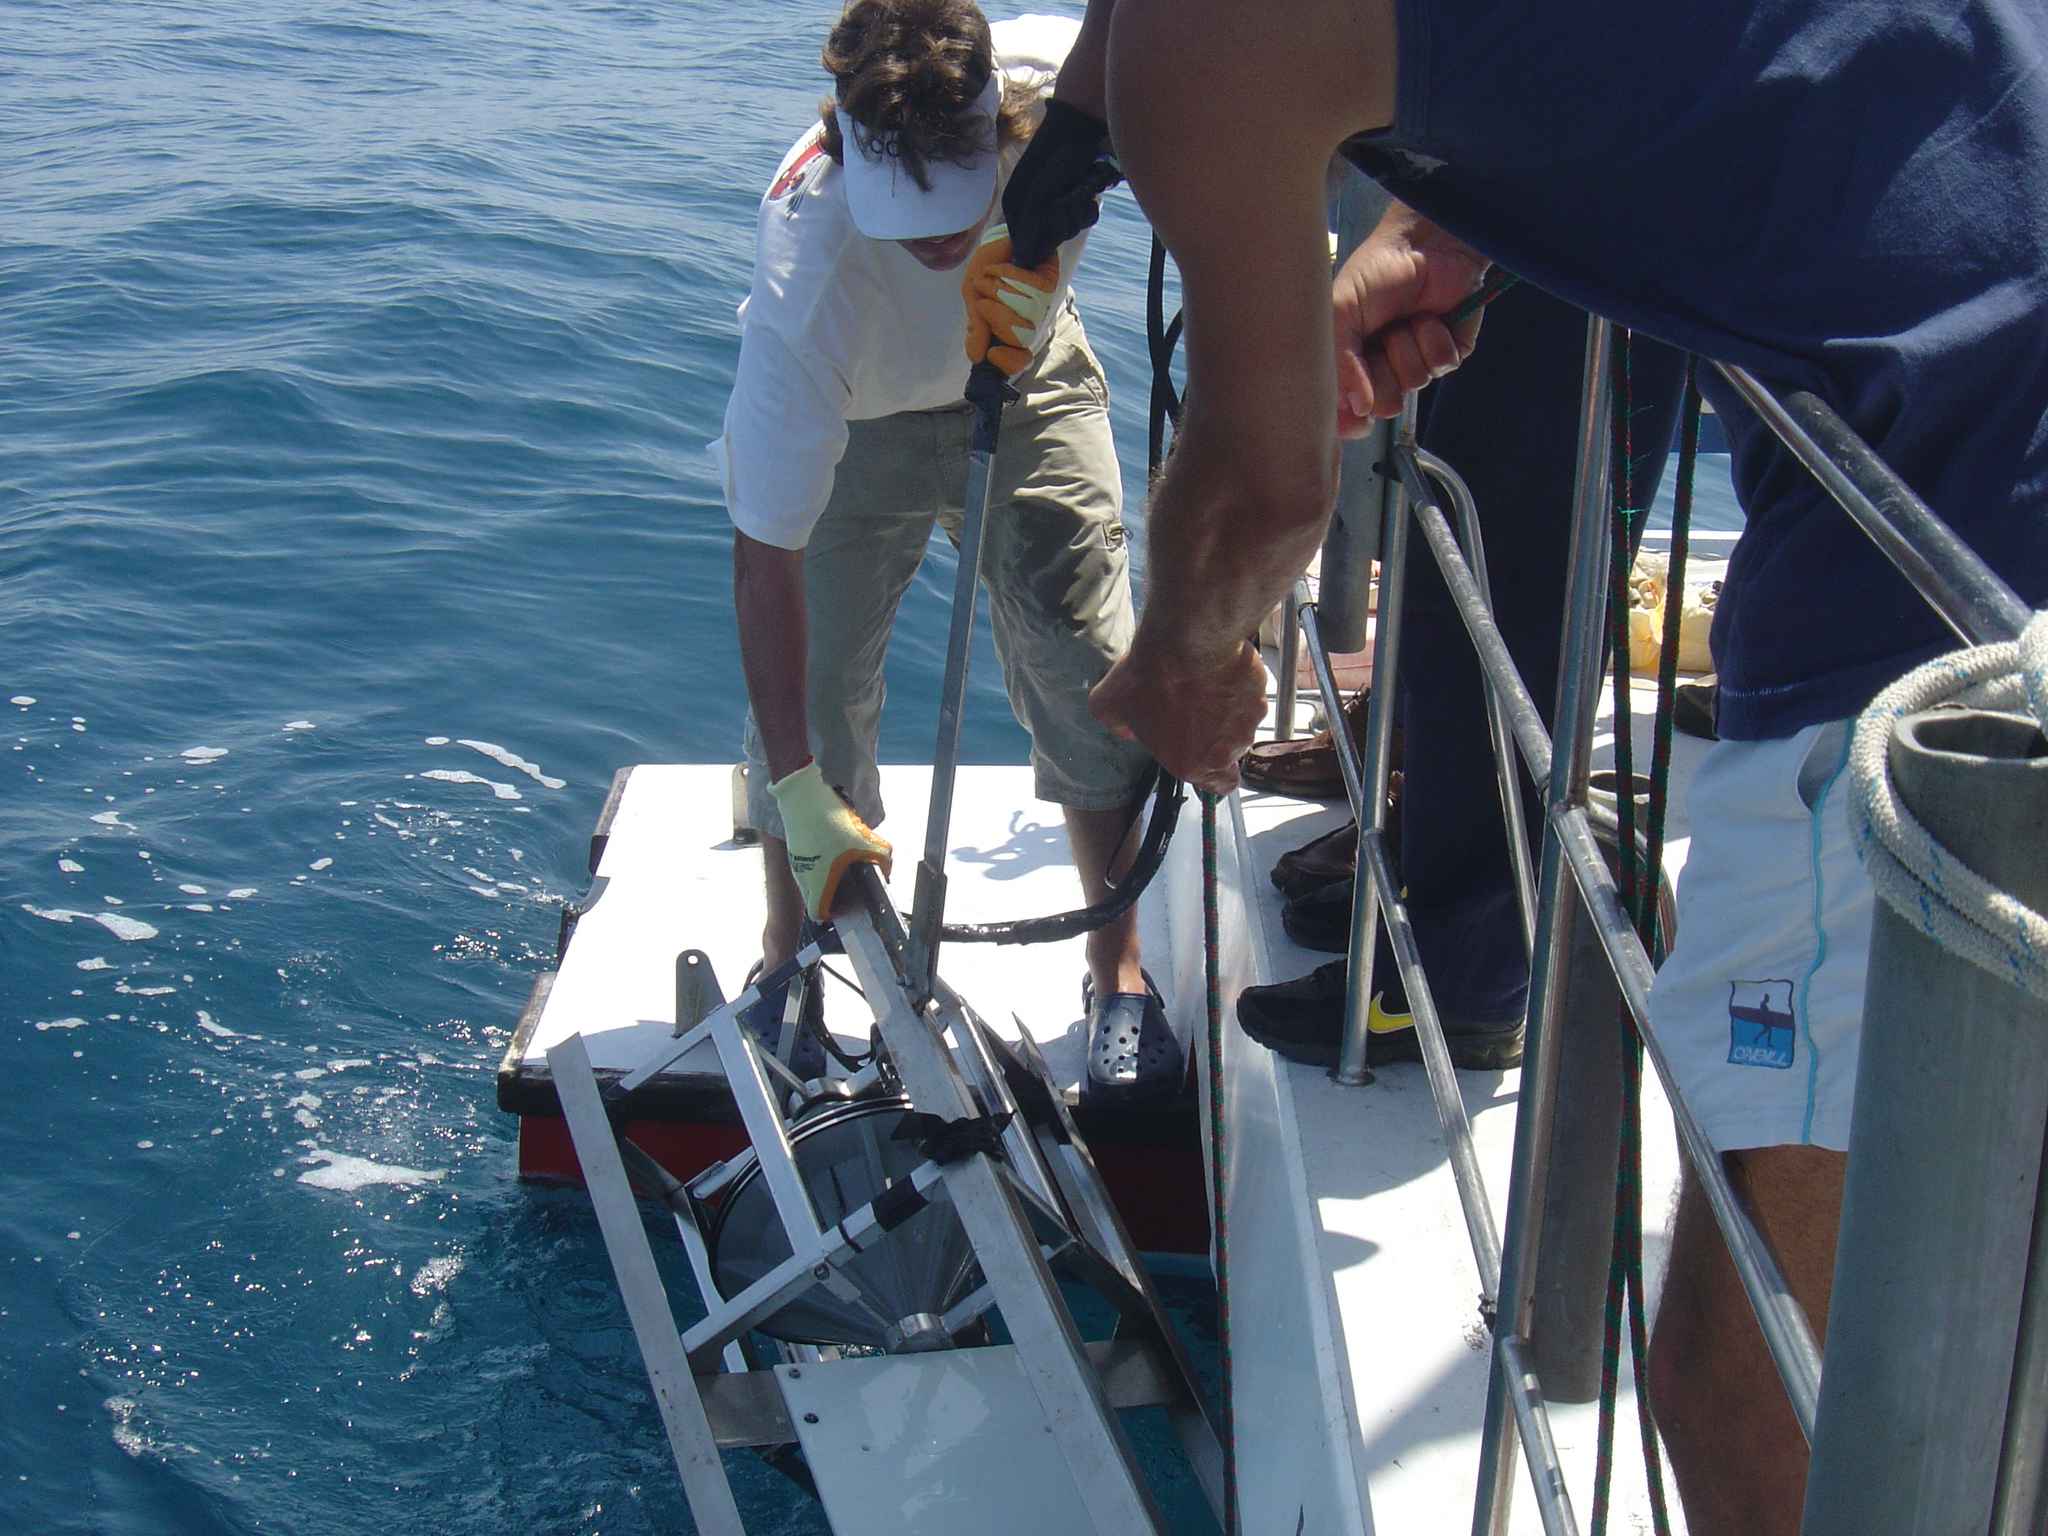
| Deploying AOB Buoy |
Day 2 movements |
 |
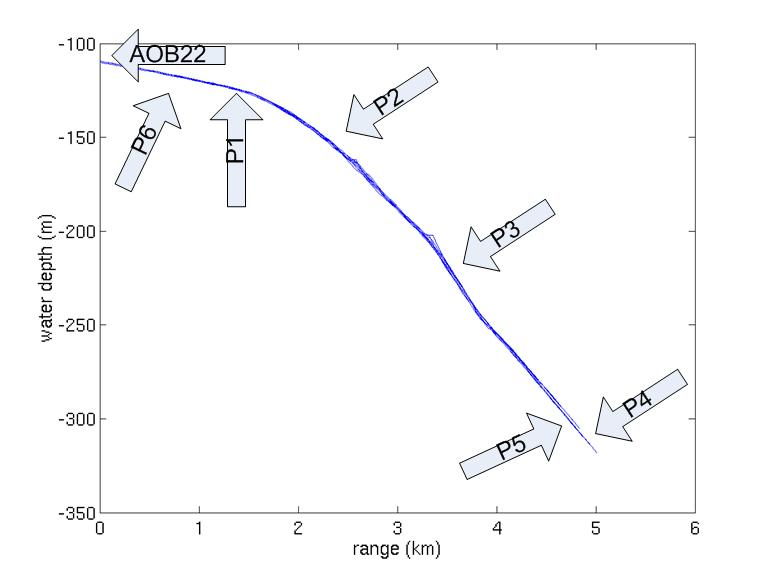 |
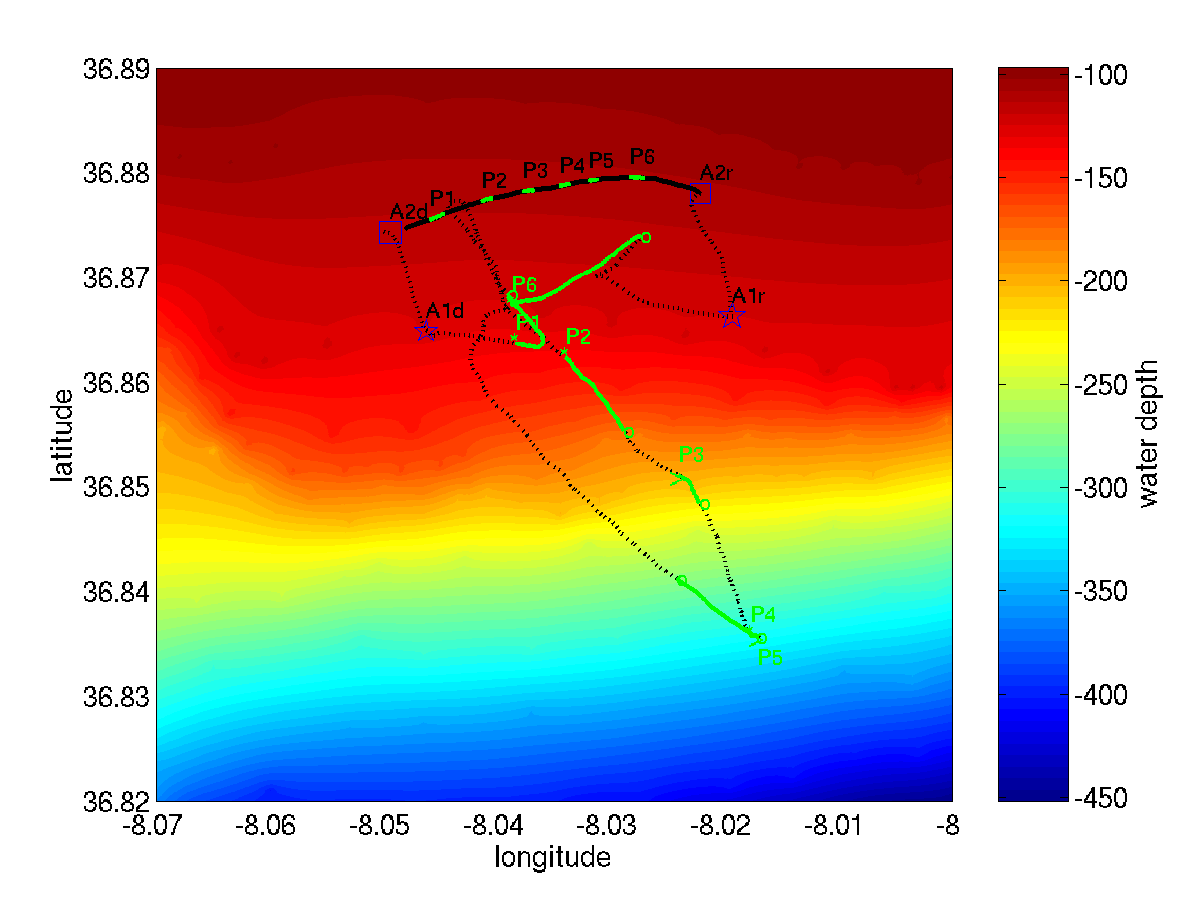
THURSDAY-24/June(Day 3):
Field calibration and communications signals were transmitted to AOB21 and AOB22 in along a range dependent bathymetry area. This area is nearly 4km east of Day 2
work area. The locations of AOB21 deployment and recovery are
represented by a star, labelled A1d and A1r
respectively. Unfortunately this buoy worked properly only a very
short period after deployment. The squares represent the AOB22
point of deployment ( A2d) and recovery ( A2d). The
AOB22 has drifted along the black curve. The water depth along
this line is about 110m. The dotted line represents the
ship/source track during Day 3, which was along the
bathymetric slope towards the deepest, being the water depth at
the farthest location about 320m. During Day 3 the field
calibration signals were transmitted during six periods 10~20
minutes long, called field calibration events. These events are
labelled as P1, P2, P3, P4, P5,
P6. The location of the label represents the starting point of
the event. The green lines over the ship and AOB22 tracks
represent the displacements of the ship and the buoy during the
corresponding field calibration events.
|
| Day 3 movements |
Location of field calibration events |
 |
 |
 |
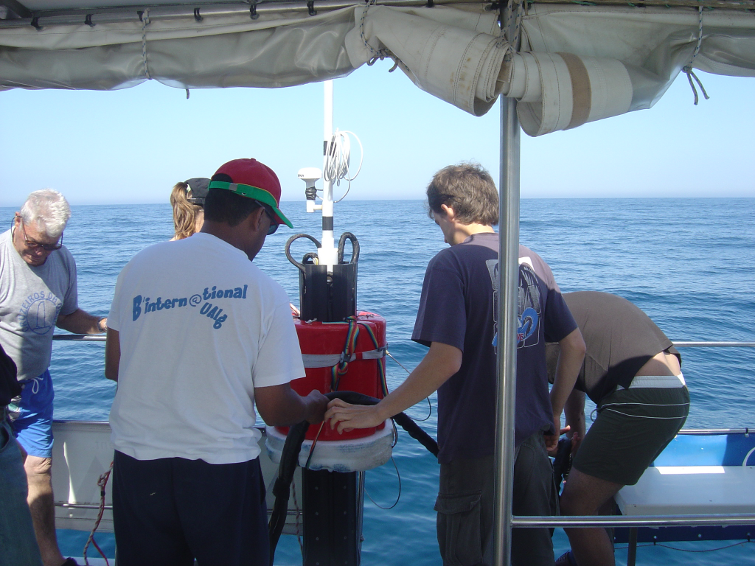
| Preparing AOB |
Recovering the source |
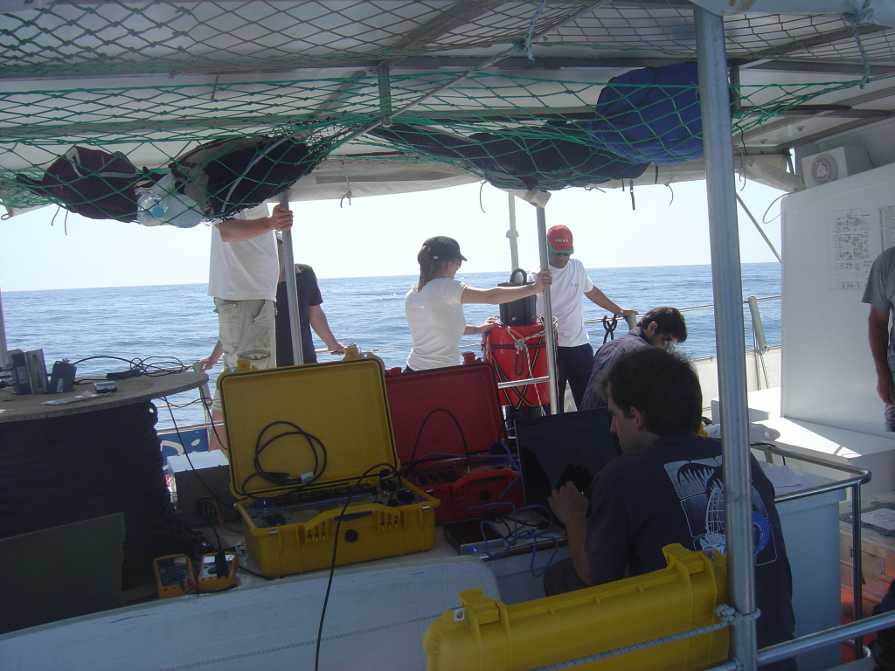
The Lab ... |