Next: Concluding remarks Up: Examples Previous: Near source fields Contents
'Munk profile/Near source field'
50.0
1
'SVF'
51 0.0 5000.0
0.0 1548.52 /
200.0 1530.29 /
250.0 1526.69 /
400.0 1517.78 /
600.0 1509.49 /
800.0 1504.30 /
1000.0 1501.38 /
1200.0 1500.14 /
1400.0 1500.12 /
1600.0 1501.02 /
1800.0 1502.57 /
2000.0 1504.62 /
2200.0 1507.02 /
2400.0 1509.69 /
2600.0 1512.55 /
2800.0 1515.56 /
3000.0 1518.67 /
3200.0 1521.85 /
3400.0 1525.10 /
3600.0 1528.38 /
3800.0 1531.70 /
4000.0 1535.04 /
4200.0 1538.39 /
4400.0 1541.76 /
4600.0 1545.14 /
4800.0 1548.52 /
5000.0 1551.91 /
'A' 0.0
5000.0 1600.00 0.0 1.8 .8 /
1
1000.0 /
501
0.0 2000.0 /
501
0.0 30.0 /
'CR'
201
-25.0 25.0 /
100.0 5500.0 102.0,
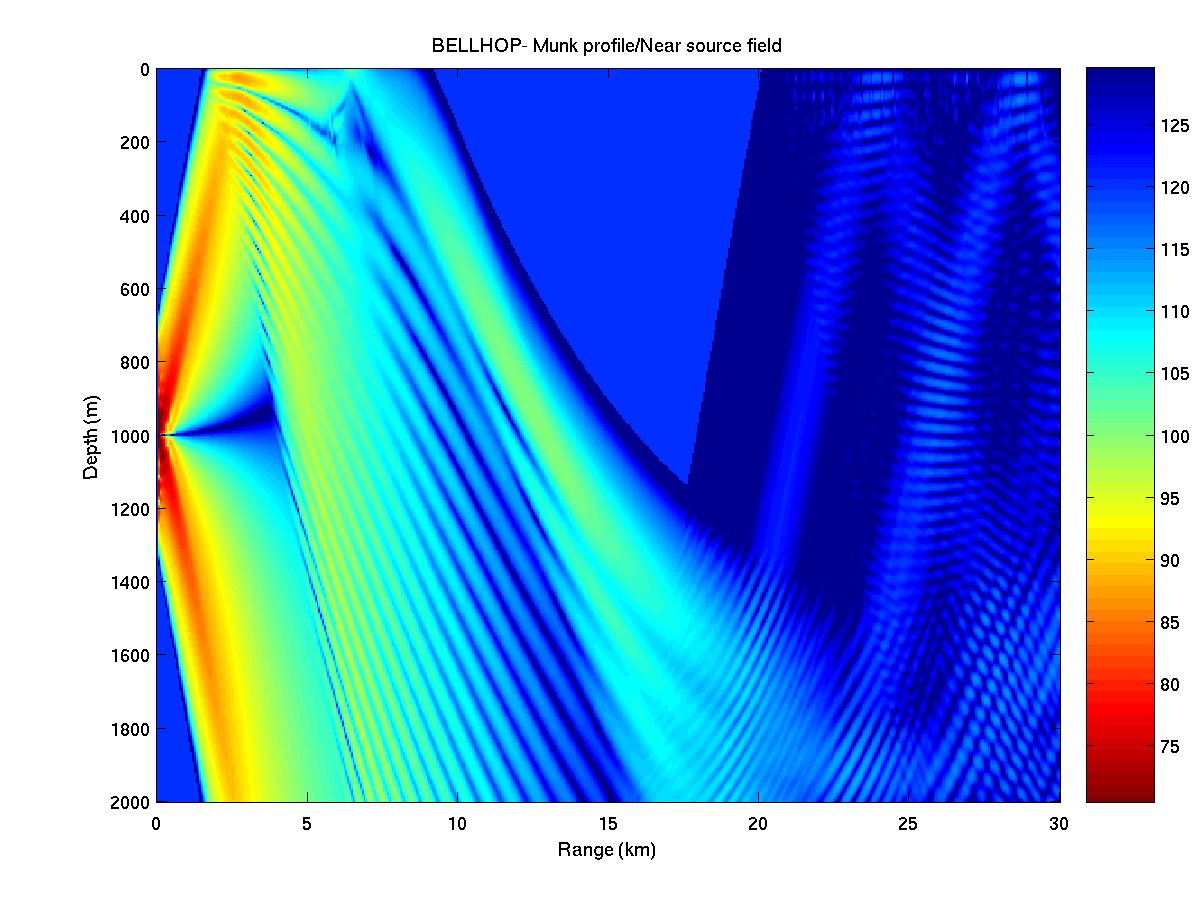
'MS' 1.0 100.0 0,
3 5
Again, running Bellhop we can obtain Fig.12.
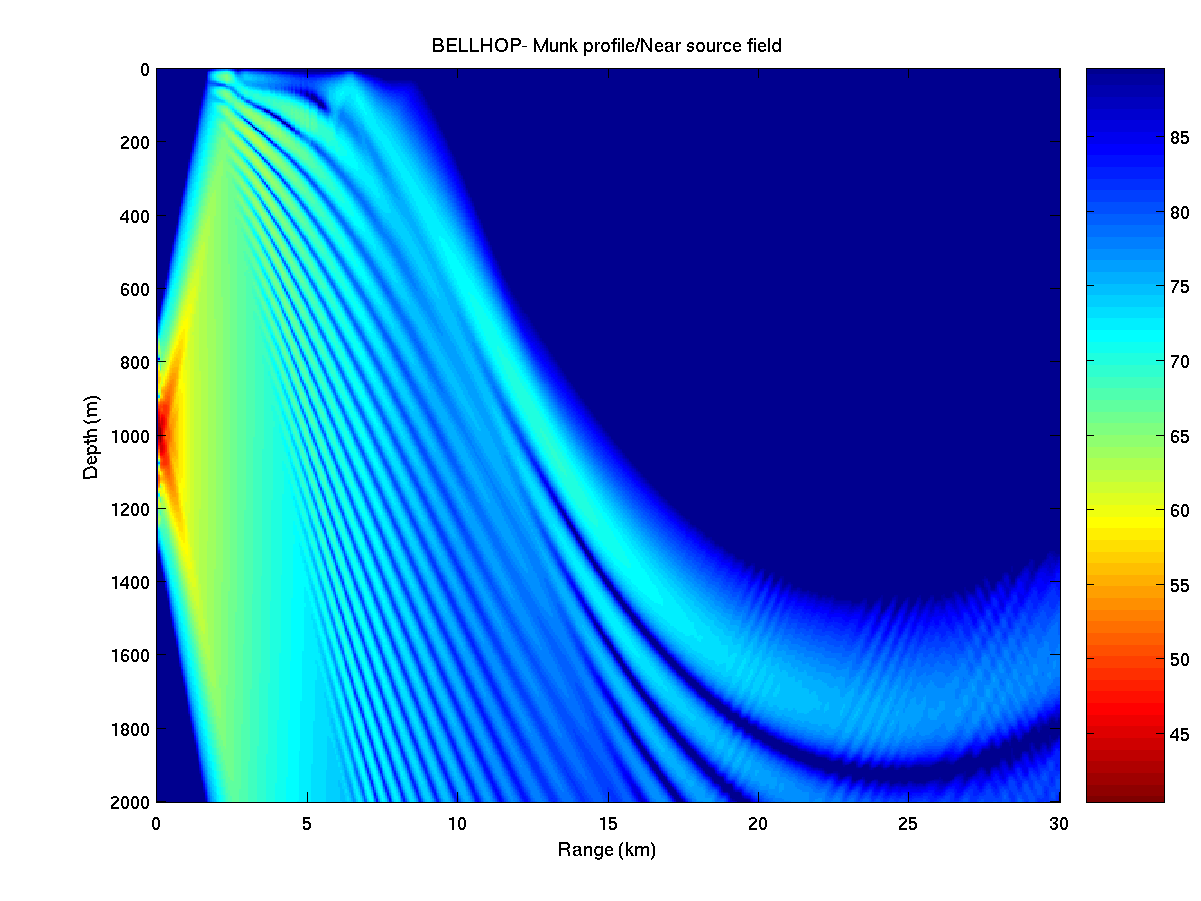
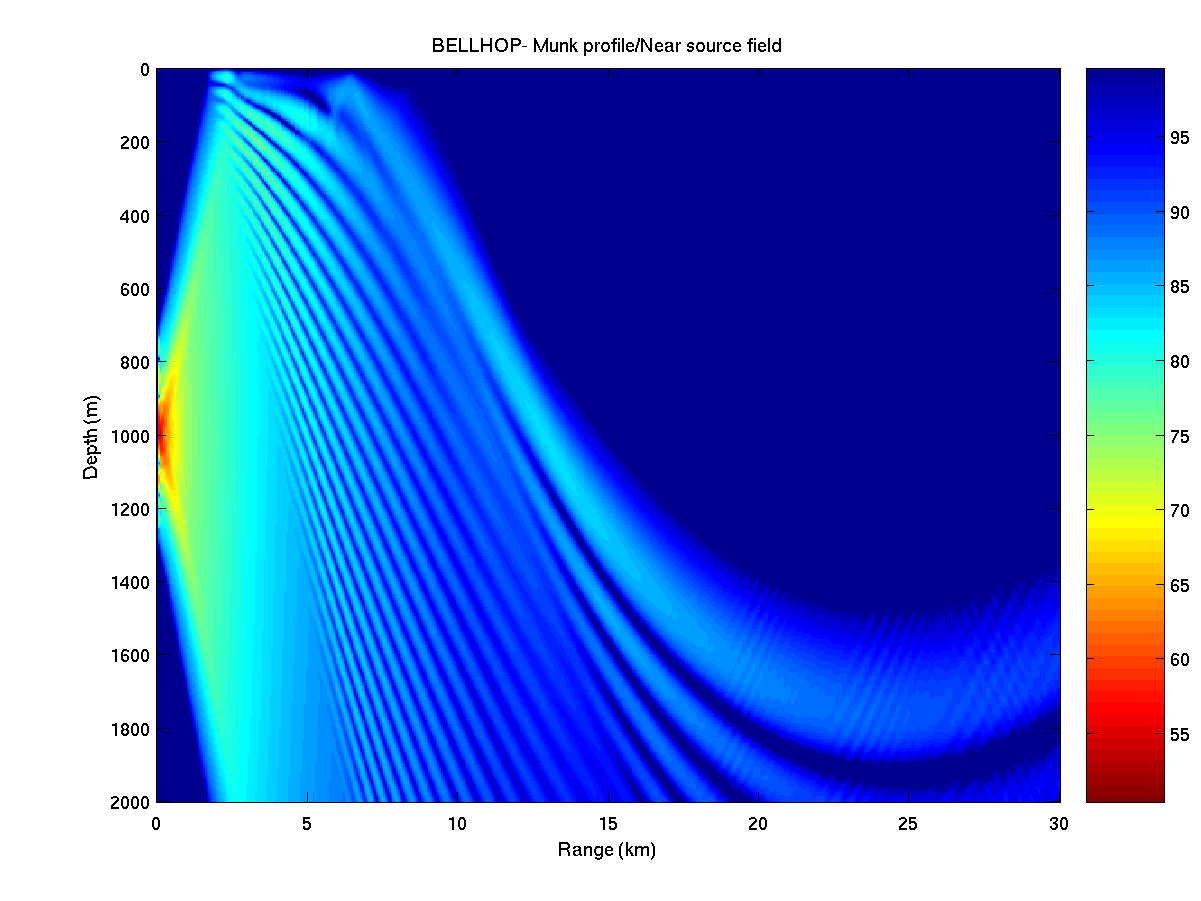
Modifying the last line to
3 5 'H'and
3 5 'V'allows to obtain Fig.13 and Fig.14, respectively.
 |
 |
Orlando Camargo Rodríguez 2008-06-16